P-H-Schema
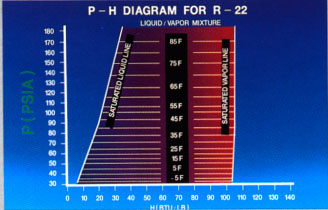
Instead of our T-x diagrams more and more complex, we can easily plot absolute pressure (ABS.) in place of the temperature to make one P-H schema. Pressure is displayed on the vertical scale of the chart and the saturation temperature written in marked with lines. These same saturation lines and points on a T-H chart shown.
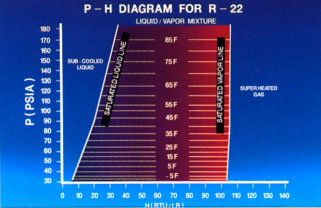
The area between the saturated liquid and saturated steam lines shows a mixture of saturated liquid and vapour. In this mixture area, closer refrigerant state of saturated liquid line, the more liquid is present. Conversely, the closer the refrigerant vapour line, the more vapor is present. To the left of saturated liquid in the line, you will see the supercooled liquid line. To the right of saturated steam lines, superheated gas, conditions are presented.
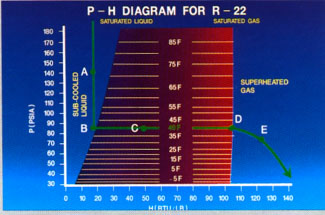
This P-H chart temperature saturation lines built in five degrees.
40F temperature line was expanded beyond the saturation point to show a normal form all temperature lines. As we can see, in this scheme, 40F refrigerant can exist in almost any condition. This can be supercooled liquids when supercooled region'kyi scheme. Point A is one such example. It can also be clean, saturated liquid (point B), the pure sated vapor (point D), or a mixture of the two (point C). It can also be superheated gas, as shown in point e, Knowing only the temperature of the refrigerant is not enough to determine its condition...
|


